Skip to content

Food or Fuel for Thought?

3 Comments

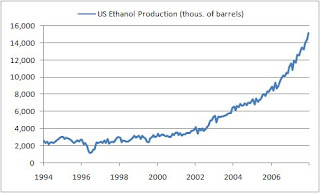
Energy prices are showing absolutely no signs of abating; those peak oil theorists may be on to something (at least in the short-run). We just don’t see oil prices coming down significantly without a considerable reduction in demand; through improved fuel efficiency or a considerable economic slowdown. Now that we have settled that, we want to tackle a potentially larger problem verse high energy prices alone. That problem is higher energy prices combined with higher food prices. As people search for alternative energy sources, they have begun to tap heavily into the worlds’ food supply (i.e. corn). Ethanol, though 9,000 years old, has had a proliferation recently thanks to lofty oil prices. According to the Renewable Fuels Association just the US is producing around 375,000 barrels per day. This equates to almost 2 billion bushels of corn a year (around 25% of the domestic use), and it’s growing. Essentially, that means 2 billion fewer bushels of corn are going into the food supply for both humans and animals. Of course productivity improvements and new farm land could reduce the overall effect, but not nearly enough to compensate for the sectors rapid expansion.

US Ethanol Production has been increasing drastically

So what does this mean for food?

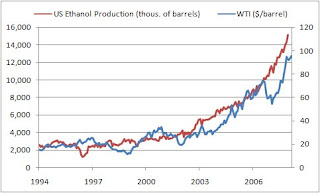
We are all aware that global food prices are rising sharply for a variety of reasons including weather and demand and supply shocks, but have energy prices had any affect?. Below we outline our view that the increasing in oil prices, have led to a substantial rise in ethanol production, and will have significant effect on food prices and eventually overall CPI. In order to have a consistent time series of agricultural prices we used the USDA prices received by farmers’ data. First off, let’s look at the relationship between WTI prices and ethanol production (chart below). As you can see below the two variables are highly correlated, this makes sense since the price of producing ethanol relative gas drops as oil prices move higher. However, the important question is what effect (if any) does the increased production of ethanol have on the food supply and prices?

High energy prices have been the driver behind the increased production

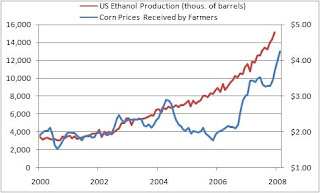
To answer this question we first analyzed corn price verse ethanol production (chart below). Again we see a strong correlation between the two, with the only anomaly being in 2005. This was caused by a good harvest and the effects of Hurricane Katrina. As we stated early the price of corn is influenced by a number of variables. Given the minimal use of ethanol prior to the beginning of this decade we do not believe ethanol production has had much, if any, affect on corn prices before now. In 1999 only 1.5bn gallons of ethanol were produced a year verse over 5bn today. That’s a lot more corn! Now that we now the production of ethanol can influence corn prices, what is the relationship of corn prices to the food and beverage CPI component and overall CPI?

Corn Prices have been influenced by ethanol production

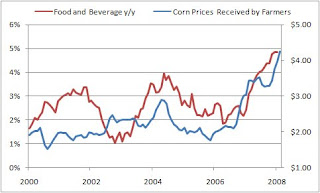
Before we start this analysis lets mention some important direct uses of corn; food, corn syrup, animal feed, ethanol, etc… Meaning corn prices can influence everything from candy to milk. Now with this in mind, we would expect a significant rise in corn prices to eventually pass-through the food chain into every product that utilizes corn. In the chart below we compared corn prices to the food and beverage component of the US CPI on a y/y basis. Again the result was not surprising; the food and beverage component of the CPI has been increasing with corn prices. Given the wide spectrum of uses for corn it is hard to judge the total effective corn would have in the index (at least for this brief analysis), but we imagine it is significant.

Corn prices have helped to drive up the overall food and beverage CPI component

Conclusion:

The massive increase in ethanol production brought on by elevated energy prices has had a significant effect on corn prices. This means that as long as energy prices remain elevated, and corn is used as the primary crop to produce ethanol, we can expect to see the prices continue on this path. Given corns multiple uses within the food industry, we can also expect to see the food and beverage component of the CPI increase as a result. Also as lower value crops are switched over to corn we may also see a rise in the price of other crops as supply comes down. One alternative on the horizon is using switchgrass instead of corn to produce ethanol. It is believed that switchgrass will be a more efficient producer of ethanol and also will not directly impact the food supple, since you can’t eat it. However, this is still in an experimental stage and will take time. The bottom line is, so long as energy prices continue to rise and ethanol production along with it, we can expect to continue seeing the food and beverage component of the CPI trending up.

Investment Idea:

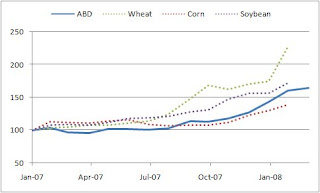
If you believe that the price and value of agricultural goods will continue to rise from cross-over to energy products and higher world demand, we recommend purchasing agriculture based ETFs such as ‘MOO’ or ‘DBA’ as a good play on the sector. However, it is important to keep in mind that speculators may have artificially driven up prices in agro indexes, so it is possible that we could see the indices catch a bid in the short-term.

Price of DBA vs wheat, corn, & soybean (rebased to 100)
Chinese Inflation: A Mounting Problem (Update)

The US isn’t alone when it comes to inflationary concerns. Chinese consumer prices continue setting new interim highs, and it is not going unnoticed. February’s CPI number came in at 8.7%y/y vs. 7.1%y/y in January. It is important to keep in mind this reading includes the adverse effects of severe winter weather and the Chinese New Year holiday. However, even after these events are factored out the reading remains well above comfortable levels (prices have been trending up since early 2007 from a level of around 1.4%y/y). The data has begun to raise a lot of eyebrows within the Chinese government. Recently, Chinese Premier Wen Jiabao was quoted as saying, “The current price hikes and increasing inflationary pressures are the biggest concern of the people.” So what does it mean?

Inflation continues trending up; as one response we expect policy makers to speed up the appreciation of the RMB

Source: National Bureau of Statistics of China & People’s Bank of China

We believe Chinese policy makers will address the rising trend in inflation using the following three policy tools: 1) The Central Bank will increase interest rates, which it hasn’t done since December 07; 2) they will allow the RMB to appreciate at a faster rate; & 3) they will implement new or stronger policies to reduce monetary growth. We also expect the government imposed price controls will remain in place for the foreseeable future. When push comes to shove we feel Chinese policy makers will choose price stability over growth. As we discussed in our last entry on this topic, from February 29th, food prices have been the primary driver behind Chinese inflation, but recently inflationary signs have started to emerge from the non-food sectors. The longer inflation remains elevated the bigger its effect on inflation expectations. In fact, according to a quarterly survey conducted by the People’s Bank of China, inflation expectations have already begun to rise (chart below). This could be bad news for policy makers since a rise in inflation expectations tends to be a self-fulfilling prophecy.

*According to a survey conducted by the People’s Bank of China consumers inflation expectations have been increasing significantly with the rise in CPI

Source: National Bureau of Statistics of China & People’s Bank of China

*Notes on the Survey of Urban Saving Account Holders (From the People’s Bank of China)- The People�s Bank of China conduct a quarterly sampling survey to urban saving account holders nationwide in the form of standardized questionnaire and interview in February, May,August, November each year. The sample size for each survey is 20,000. 4 diffusion indices are derived from the replies of interviewees in questionnaire survey, which reflect the attitudes of people towards current income and price conditions, and the expectations to future income and price trends.

Inflation, Inflation, Inflation

Inflation, we have been talking about, the market has been talking about it, but has the Fed? In short the answer is yes, but it appears the market may not think so. For the first time since its introduction in 1997, the 5-year TIP traded at a negative yield, implying a significant lack of confidence in the Fed’s ability to fight inflation. The market is essentially betting that the Fed has lost sight of inflation and is solely targeting growth. We do not agree with the market’s assessment. First off, lets rehash an early blog post titled ‘Fed Cuts & Inflation’ :

“So long as the Fed considers downside risk to growth exists we can expect that rate cuts will remain on the table as long as Core PCE remains below the 2.7% to 3.0% range, or growth conditions do not deteriorate more significantly.

To be more specific, so long as demand continues to be a drag on growth and inflation remains within a ‘comfortable’ level, the Fed will cut rates. However, if inflation exceeds the Fed’s comfort level (as defined above), then we would likely see a quick reversal of policy, or at least the end to rate cuts. Core PCE for January finished 2.18%y/y vs 2.23%y/y the month prior. The Fed has not forgotten their dual mandate. The Fed realizes inflation is trending up, and it is clear that in addition to rate cuts they are looking for alternative methods to alleviate the credit crisis.

With this in mind, to us today’s Fed announcement implies a smaller rate cut at their official meeting on March 18th. We were originally calling for a rate cut of 75bp, but this move, pending how the market reacts over the coming days, changes our forecast to 50bp (with 25bp being a possibility). Of course the relationship between further easing and inflation wasn’t the only topic on the Fed’s mind in making this decision, but it was probably a factor. The bottom line is the Fed is well aware of inflation and will act accordingly. Markets can only trade irrationally for a finite period of time.

Now What? The Week Ahead

Last week’s performance was pretty much in-line with our expectations, as outlined in our March 2nd post. But what’s going to happen this week? The beginning of this week is going to be relatively quiet on the data front. However, we will be ending the week with some important consumer related data including CPI, Retail Sales, and Consumer Sentiment (See calendar below).

Nevertheless, the main question this week will be whether or not the Fed cuts rates before the March 18th meeting and if so by how much. First the easier question, we anticipate the cut will be 75bp. Now the harder one, we think that we are close enough to the March 18th meeting for the Fed to wait. However, this will be very market dependent. If the market experiences a significant sell-off, then we are likely to see the Fed to act early. Typically, when the Fed delivers unexpected news (such as a rate cut) it usually occurs between 8:15AM and 8:30AM, so please be on the lookout if this scenario does plays out.

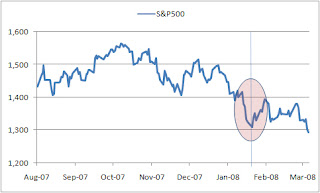
If you believe, like us, the Fed would intervene to stem any significant sell-off, then this week could turn into a good buying opportunity. Essentially, the potential Fed rate cut would work as a partial hedge against market risk, not a bad deal. The Fed has a tendency of not disappointing market expectations, and this will not change in the short-term, especially now. So if the market does experience a significant sell-off we would expect the Fed to act (as they did on Jan. 22nd) and potentially generate at least a short-term rally (See chart below for SP500 performance during the Jan. 22nd cut). At the same time, if the market does not experience a sell-off, the increased likelihood of a 75bp cut at the next Fed meeting should help bolster market performance.

S&P500 performance during Jan. 22nd inter-meeting rate cut


Market performance will remain very dependent on news from the financial industry and economic data releases. Here are the economic releases that could affect the market this week:

Monday March 10th:
None

Tuesday March 11th:
8:30AM: International Trade (Risk: Neutral)- According to Bloomberg.com the market is currently expecting a trade deficit of USD59.5bn vs. USD58.8bn last month.

Wednesday March 12th:
None

Thursday March 13th: Key Day in a Quiet Week
8:30AM: Retail Sales (Risk: Slight Upside)- According to the consensus survey Retail sales are expected to increase 0.2% M/M for both the headline and core reading. There could be some upside to this release from better than expected sales figures for discount retailers such as Wal-Mart

8:30AM: Import Prices (Risk: Slight Downside)- Bloomberg.com currently states a market consensus of +0.6% M/M change in import prices. Increased commodity and food prices will continue to put pressure on import prices. The big concern is how strong the pass-through effect will be to the overall CPI.

8:30AM: Jobless Claims (Risk: Downside)- Bloomberg.com currently states the market is expecting a reading of 358K. We find this to be one of the most important indicators for the health of labor market. Given continues weakness in the labor market, and signs that the commercial construction industry may be on the verge of slowing; we believe this number has the potential to surprise to the upside. Basically, any reading below 350K is considered relatively healthy, and above could warn of a recession. The 4wk moving average currently stands at 359,500. Non-farm payrolls tend to be a lagging indicator of overall economic health, while jobless claims tend to be a leading indicator, hence its importance.

10:00AM: January’s Business Inventories (Risk: Neutral)- The consensus survey expects business inventories to increase 0.5% M/M.

Friday March 14th:
8:30AM: Consumer Price Index (Risk: Neutral/Slight Downside)- The consensus survey is expecting a 0.3% and 0.2% M/M increase in CPI and Core CPI, respectively. Growing food prices, high commodity prices, and a weak dollar will continue putting upward pressure on CPI. However, how much of this will be nullified by decreased demand is yet to be seen. For more on the importance of inflation and Fed Cuts please see our Feb. 27th posting (http://fiateconomics.blogspot.com/2008/02/fed-cuts-inflation.html).

10:00AM: Consumer Sentiment (Risk: Downside)- The market is currently expecting a reading of 69.5 after experiencing a free fall last month to 69.6. Given last month’s drop it is hard to make an accurate measurement, but we believe it is likely to come in below current expectations.

*Investment Idea:

We believe the fact that the Fed has always delivered news of inter-meeting rate changes to the market at around 8:15AM EST can be used to our advantage. Take this for example, if the market experiences a significant sell-off and an inter-meeting cut seems likely, you could purchase futures on U.S. Indices just prior to the 8:15AM EST expected announcement. If the cut does occur, then we should see a rally in future prices, and the position could be unwound within 15 minutes. If a rate cut does not occur, the position could be sold within a very short time frame helping to minimize any losses. Since you are only holding the position for a short period of time downside risk should be relatively mild, while potential upside if the cut does occur could be significant. However, you could face other risks such as negative company or sector news being released while you are holding the position. This notwithstanding, if this scenario comes about we believe the risk is worth the potential short-term gain.

*There is substantial risk in trading futures, so please make sure you know what you are doing! Also, this is an investment idea not advice so trade at your risk.

How will it end?

We are continuously being barraged with mixed news concerning the housing crisis. One day we hear signs are pointing towards a bottom; the next housing numbers came in much lower than expectations. So we raise this question: What indicators should we be looking at to truly signal a recovery in housing?

With this question in mind our analysis focused on creating the stages we believe would be necessary to facilitate a recovery. We were able to define 7 chronological stages which need to occur in order for the crisis to end. Additionally, the progress for each of the stages can be measured by several key indicators. The stages we outline below are meant to help to average investor better understand how a recovery will most likely unfold, and includes indicator that anyone with a basic internet connection will be able to easily access.

Our stages and key indicators to watch:

1. The number of defaults from subprime borrowers needs to drop substantially. This will help to stabilize growing inventory levels. Key Indicator(s): RealtyTrac foreclosure data (monthly) & MBA foreclosure data (quarterly)

Subprime ARM mortgage resets continue to be the primary driver behind subprime foreclosures (July 2007-November 2009)


2. Banks need to lower lending standards for home mortgages. This will allow existing and new home sales to increase and prices to stabilize. Key Indicator(s): Fed Senior Loan Officer Survey, mortgage rates (quarterly), Case Shiller Home price index (monthly), & New and Existing home sale prices

However, lending standards have tightened across all mortgage types according to the Senior Loan Officer Survey
Source: FRB

3. Once people are again able to buy homes we will see a reduction in inventory levels. When this occurs demand will rise for new constructions. Key Indicator(s): New home sales data (monthly) & Existing home sales data (monthly)

But for now increased Foreclosures and tighter Lending Standards have caused New Home Sales to drop
Source: Census

4. The rise in demand for new construction will first show up in building permits. The rise in building permits will lead to our next step… Key Indicator(s): Building permits data (monthly)

But, building permits have shown no signs of relief
Source: Census

5. Very soon after the rise in building permits we will see an increase in housing starts. Key Indicator(s): Housing starts data (monthly)

Currently, with Permits being repressed, Building Starts are acting accordingly
Source: Census

6. The increase in starts will lead to an increase in construction spending. Key Indicator(s): Construction Spending (monthly)

As you can see from this chart, this is not yet the case
Source: Census

7. Finally, residential investment begins to rise and the housing crisis is over. Key Indicator(s): Residential Investment via GDP release (quarterly)

Conclusion:

Essentially, this crisis is occurring due to a substantial increase in the supply of houses through subprime foreclosures, and a decrease in demand to buy houses through harder to get mortgages. As more homes enter the market and less people are able to acquire mortgages to by them the price drops. Hence, the first major step in a recovery for the sector will be a slow-down in the number of foreclosures, which likely will not occur into the early parts of the second half of this year. Secondly, and equally important banks need to reduce lending standards to allow qualified buyers to purchase new homes. These two actions combined will begin to reduce the inventory of homes on the market and stabilize price. Once the amount of inventory of homes for sale begins to drop, we will see demand for new constructions begin to rise. This will first show up in the building permits index, followed by housing starts, and finally private construction spending. All in all, this will not be a fast process, with the reduction in foreclosures and lowering of lending standards being the hardest hurdle to overcome.

Currently, the primary driver for subprime foreclosures are interest rate resets. When these borrowers we first given their mortgages they were given low teaser rates which would eventually reset into higher adjustable rates. Meaning some mortgage holders who were paying USD1,200 a month for their mortgage in November could be paying USD3,200 a month in December. For a lot of these borrowers it has been nearly impossible to pay the new amount and they have been forced to default. On a positive note, based on available market information we should see the number of resets for adjustable rate subprime mortgages peak sometime in late spring/early summer. However, this means there are still a lot of resets in front of us which will prevent a sustainable recovery over the next few months. Are best estimates are indicating we should start to see the early signs of a recovery in 3Q08.

Investment Idea:
Once a the market starts showing signs of a sustained recovery we feel that US home builders could significantly benefit. US homebuilder stocks have been pounded since the housing crisis first began, and will be poised to make a recovery as demand for new homes eventually rises. However, as we said this could take some time, but it will happen. In fact, we recently witnessed a rally in the sector when the market misinterpreted last month’s housing data to imply we had reached a bottom. To us this means we aren’t the only people looking at this trade. We had actually picked up a long position of ITB at around 18 with the intent of holding for the long term. However, when the market rallied on what we felt wasn’t substantial evidence for a recovery we sold the position at around 21. The ETF has since returned to trading at around 16, and we are considering re-purchasing for the long-term.

Performance of Home Builder ETFs
Source: Bloomberg

The Baltic Dry Index (BDI): Can it tell us anything?

BDI Revisited in new entry written 11/08/2008

Globalization and world trade has become the major growth force in emerging market economies and has significantly influenced developed nations as well. The big question is; how or has the US led slowdown affected this trend. There are of course a series of indicators we can look at to determine the size and value of international trade. But for this analysis we are going to take a look at a less discussed indicator, the Baltic Dry Index.

The BDI is showing a bit of a recovery

What is the Baltic Dry Index (BDI)?
To put it simply, the BDI is a daily index which tracks the shipping costs by sea for various materials including metals, grains, oil, etc…

Why we think it is important?
You can’t just build a new cargo ship… When demand for shipping goes up and the supply of boats remains constant prices will go up. Hence we can use the BDI index as a gauge for the demand of shipping and a proxy for the level of international trade. In fact looking back on the data we can see a high correlation between global trade and the BDI. Keep in mind other factors such as oil prices can affect the BDI, but at the same time shipping companies can mitigate these effects by hedging and reducing speeds to conserve fuel.

Most importantly the BDI is a daily index, so we can track demand in the shipping industry in real-time. So if the slowdown is affecting global trade we will see it now not later, and a change in demand for exports could have huge impacts on a lot of economies.

What is the BDI telling us now?
The BDI reached unprecedented levels in 2007, corresponding with the rise in international trade. However, we have recently seen a decline starting in December of 2007, corresponding to the slowdown in the US. The positive news is that it appears the BDI bottomed on Jan. 29th 2008 at 5,615, and is staging a bit of a recovery now at 7,993 verses it high of 11,039 in October. Although it is tough to say how much of this is could be oil related.

Interesting to note is that Canada experienced an 8.5% drop in exports in 4Q07; Canada is the US’s largest trading partner. Australia also saw a weakening of exports during the same period.

Conclusion:
We do believe global trade is being affected by the US led slowdown, and that this indicated by the BDI index. The good news is since the BDI is that since it is a daily index we can get a real time idea of what the slowdown could mean to global trade. The bottom line is we think that in this day and age the BDI is an index which should get more attention despite its imperfections.

There is a significant correlation between the qoq change in US (imports +exports) and the BDI…

ADDED LATER:

We wanted to look at the relationship between the BDI and an ETF of natural resources companies, since this industry would make significant use of international freight shipments. However, we could not find a suitable ETF, so we used the equity price of BHP Billiton. The results were not surprising. As expected there was a significant relationship between the stock price and the index. To us this suggests the BDI is heavily influenced by raw commodities exports (which makes sense), and provides an excellent gauge for the global demand of raw commodities.

The BDI has a significant positive relationship with the EQ price of BHP.

A Potential for Blood-letting: The Week Ahead

This week has some serious downside potential… Lets take a look at some of the more important indicators, and see which direction we think the risk lies verse expectations.

Monday:
10:00AM: ISM Mfg. Index (Risk: Downside)Currently, the market expects a reading of 48.1, verse 50.1 from the prior month. We believe given the poor performance of the regional surveys (Philly & NY Fed) and consumer confidence we could see some downside risk to the markets expectations. At the same time, it will be very important to look at the new orders and prices paid sub-component of the report. New orders tends to be a rather good forward looking indicator for the index, and of course prices paid will tie in heavily to current inflation concerns. Bottom line, we could see a strong headline number and still see the market catch a bid, or vice versa based on these sub-components.

10:00AM: Construction Spending (Risk: Downside)- The market is anticipating a 0.7%m/m decline in construction spending. The reason we see a downside risk to this indicator is because housing related indicators have continue to decline, and the most recent Senior Loan Officer Survey indicated a further tightening to lending standards. This data will, despite its importance, likely take a back seat to the ISM report being released at the same time. This release will most strongly be felt in the homebuilder stocks (ex. ETF: ITB). This indicator also tends to be a good indicator of the effectiveness of Fed Policy.

Tuesday:
None

Wednesday:
8:15AM: ADP Employment Report (Risk: Neutral)- Not much I can say about this, other than it will set the mood for Friday’s Non-farm release, and get a lot of media attention. If this release were to come in higher than expectations we could see a slight rally in the market. However, the inverse is true as well. Currently, the market wants to see news that would support a rate cut, but at the same time not signal an imminent recession.

8:30AM: Productivity and Costs (Risk: Neutral)- We do not expect many changes from the previous number. However, pay attention to any outliers as it will affect the market.

10:00AM: Factory Orders (Risk: Neutral)- The market is currently expecting a reading of -2.5%, based on the recent weakness in durable good orders. We feel this expectation prices the weakness in durable goods in fairly well. This would be the first decline in factory orders in 5 months.

10:00AM: Non-Manufacturing ISM (Risk: Neutral/Slight Upside)- The markets expects Non-Manufacturing ISM to come in at 47.5, after falling to 44.6 last month from well above 50. Though not as important as the manufacturing ISM, this indicator is starting to garner more attention. However, we do not believe this indicator will be enough to turn-around market sentiment if the week plays out as we are expecting.


Thursday:
8:30AM: Jobless Claims (Risk: Neutral)- We believe the initial claims number will remain above 350K, with the 4wk moving average continuing to edge up. This is bad news for the market. Initial jobless claims tend to be one of the best forward looking indicators at predicting a recession. A number below 350K tends to be safe, and above that level the probability of a recession increases dramatically.

Friday: The Main Event!
8:30AM: Employment Report (Risk: Negative)- Currently, the market anticipates an unemployment reading of 5.0% (vs. 4.9%) and an increase in non-farm payrolls of 25K. However, given the recent weak performance in initial claims we believe February’s number has the potential to disappoint. We will further clarify our view once we see this week’s jobless claims data and the ADP report.

Conclusion:
The bottom line is we expect another volatile week of trading without much upside. However, we could see another good buying opportunity come the end of the week. We believe once the market comes to a consensus on whether there will be or not be a recession in the US a lot of the volatility caused by uncertainty will be taken out of the markets and we may start to see the beginning of a sustainable recovery, of course the recovery would be quicker given the latter scenario.

Chinese Inflation: A Mounting Problem

I was asked my views on the Chinese inflation situation today and came up with this short piece:

The Chinese growth story is now sharing the spotlight with the country’s mounting inflation concerns. In January consumer prices rose 7.1%y/y; to a level not seen since 1996, a point when China was in the midst of recovering from levels around 20%y/y. Moreover, based on the current outlook February’s reading is not expected to show any signs of improvement. Starting late January and ending in February China faced a barrage of disastrous winter weather, affecting nearly every aspect of the economy, including crops. This is particularly relevant given that food prices have been the main cause of Chinese inflation, increasing an astonishing 18.2%y/y in January. Important to keep in mind is that January’s reading includes only a small portion of the storm’s total effect, which will be fully reflected in February’s release.

Drilling a bit deeper into China’s inflation problem we look at some of the reasons for the increase in food prices. In part this trend can be attributed to China’s economic success; Chinese economic growth has led to an increase in wealth among its population. With more money to spend Chinese citizens tastes began to shift, in the food sector this meant instead of having vegetables for dinner they preferred meat, especially pork. Since demand for these ‘new’ products are rising faster than they can be supplied, prices are going up. Despite the simplicity of this explanation it could have a significant effect on the Chinese economy. Take this scenario into account; if you expect dinner is going to cost more next month than it did today you are going to ask for better wages to make up the difference. With this in mind inflation expectations have a direct correlation with future inflation based on this principle. Currently, we believe this scenario may already be occurring. Price increases are now showing up in sectors other than food, including services, producer prices, and other non-food products. The increase in service prices could very well imply we are already seeing an increase in the cost of labor due to rising inflation expectations. This scenario will have to be watched closely by Chinese policy makers.

Curtailing the inflation problem will be a tough challenge for Chinese leaders, especially given an increase to inflation expectations. In a more traditional scenario, the solution would simply be a combination of tight monetary policy and conservative fiscal policies. However, a number of problems including reconstruction plans from the winter storms, ‘quasi’ pegged exchange rate, and liquidity factors add up to a unique challenge. Reducing government spending at a time when a large portion of the country’s infrastructure needs to be repaired is not feasible. Additionally, further appreciation of the RMB could reduce exporters’ price advantages to overseas competitors and may reduce Chinese market share lowering economic growth. Finally, increasing rates could make it harder for businesses to borrow within China during a time of industry consolidation; potentially adversely affecting growth. A likely outcome will come by finding a balance between tighter monetary policy and further appreciation in the RMB.

Fed Cuts & Inflation

*Sorry for the delay in posting we were experiencing serious computer issues

One of the questions on everybodys’ minds is how high would inflation need to go before the Fed would reconsider any further rate cuts. During the recent months’ we have seen increasing down side risks to the US growth forecast, while at the same time growing inflation expectations. This is a dangerous mix in terms of continuing to use Fed policy as a stimulus to the economy. Historically, looking back at the data (since 1995), we can see that the Fed has never lowered rates when the Core CPI has gone above 2.9%, this means we could have at some room left, before the Fed rates cuts could potentially come off the table. To further test this we applied an ordered probit model with a grouping of economic indicators (ISM, core PCE – 2.0% inflation target, & a 1 month lag in the change in initial claims – 350) to see how the current situation compares to those in the past and to see which way the Fed is likely to move and in what magnitude based on inflation rates. What we discovered after running the model for both Core CPI and Core PCE (which we see as the Fed’s indicator of choice) was in-line with our original estimation that for the Fed to reconsider the cuts we would need to see the Core rates move to between 2.7% & 3.0%. Currently, the Core PCE and Core CPI are at 2.2% and 2.5%, respectively, with expectations rising.

To quantify the rate change we created five categories ranging from –2 to 2, with 0 implying no change. We created these categories after individually analyzing all FOMC rate changes from 1995 until 2007. To quantify the change we categorized the magnitude of the Fed rate hikes or cuts at each individual meeting into three groups: 0, 0.25%, and =>0.50%. So for example, a rate hike of 0.50% points would lead to a score of 2, while a rate cut of 0.25% would equal a score of -2.

With the left-hand side variable defined this way we ran them using an ordered Probit model against the ISM, inflation gap, and initial claims. We found that all of the variables were statistically significant.

The results show that the implied Fed rate change currently stands at -0.03 on our scale of -2 to 2, and has decreased in intensity over the last two months from its interim low of 0.09 in June (Chart 1). This movement corresponds to the decreasing growth and wavering employment levels. The current reading shows that there is a downward Fed bias, which implies the Fed is more likely to lower rates rather than raise them…

Conclusion:

So long as the Fed considers downside risk to growth exists we can expect that rate cuts will remain on the table as long as Core PCE remains below the 2.7% to 3.0% range, or growth conditions do not deteriorate more significantly.


Fed likely to go 50 (Another look at China, India, Las Vegas Sands, and an introduction to Taiwan)

This mornings GDP reading of +0.6% will outweigh the positive ADP number and lead to an additional cut of 50bps at today’s meeting. However, if the Fed were to cut by only 25bps we would expect a large sell-off in the US and global EQ markets; leading to in our opinion to another good buying opportunity. Fundamental economic data in the US is still not pointing towards a US recession, but both the EQ and FI markets continue to price one in. Our view is that the housing problem continues to be just that, a housing problem. We would need to see a clear spill-over into consumption before we began to worry. Keep in mind housing wealth is only a small component of consumption, with financial wealth and income making up the rest. Financial wealth and housing wealth tend to have a lagged and marginal effect on consumption verses income whose effect is both strong and immediate. Meaning, so long as we continue to see good employment (claims below 350K, etc..) and growing income levels we do not expect to see a recession. The way we see it is that we are still in the midst of a good buying opportunity and remain bullish on China, India, and Las Vegas Sands.

As an aside, we are now looking into the Taiwanese EQ market. The recent parliamentary elections in Taiwan provided the China ‘friendly’ party with a landslide victory; a result which is likely to follow in the March 22nd Presidential elections. Once the new administration takes power they will likely strengthen ties with China and Taiwan will begin to share in China’s economic success, from which it has remained mostly isolated. To take advantage of this market we are looking into the ETF ‘EWT’, which attempts to track the braod Taiwan EQ market.