Prior to prohibition there were a large number of craft breweries in the U.S., during prohibition they all of course were forced to close. In the years following the repeal of prohibition Americans acquired a taste for questionable quality macro-breweries (Bud, Pabst, Coors, etc).
About a decade or two ago the craft beer movement in the U.S. started a resurgence with the likes of Samuel Adams and Anchor Steam. In fact over the last couple years the number of craft brewers in the U.S. has again reached the levels seen prior to prohibition. According to the Brewers Association “1,753 breweries operated for some or all of 2010, the highest total since the late-1800s.”
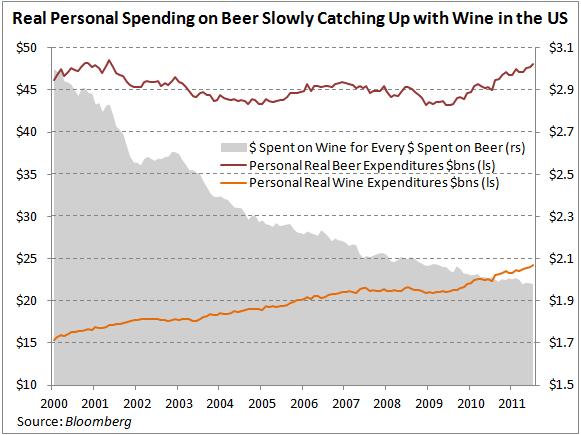
So Americans are re-acquiring a taste for better, more expensive beer, which is why we are most likely seeing the amount of money spent on beer rising relative to wine. I am in favor of this trend, and really enjoy the growing selection of high quality craft beers.