Skip to content

Chinese Healthcare Sector ADRs

As an additional follow-up to my ADR series, I am going to take a look at the Chinese and Hong Kong healthcare sector. There are 6 key Chinese and Hong Kong ADRs within the GICS healthcare sector: Mindray Medical International (MR), Chine Medical Technologies (CMED), Wuxi PharmaTech (WX), Simcere Pharmaceutical (SCR), 3SBio (SSRX), and Tongjitang Chinese Medicines (TCM)

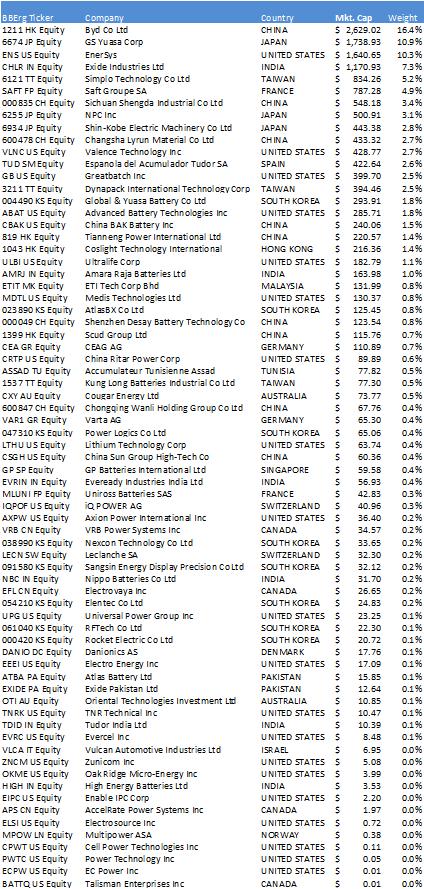
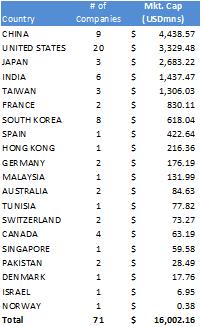
Chinese & HK Helathcare Sector ADRs

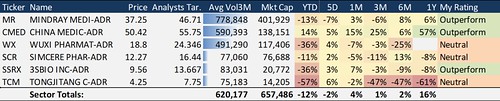
Source: Bloomberg (Closing prices 8/7)

The Companies:

Mindray Medical International (MR, Outperform): Mindray Medical International Limited develops, manufactures, and markets medical devices. The Company offers patient monitoring devices, diagnostic laboratory instruments, and ultrasound imaging systems. (Bloomberg)

MR’s outlook in a nutshell: Unlike the other companies discussed in this piece MR has significant exposure to both Chinese and ex-China markets; it is also the country’s largest medical device company. The medical devices sector is still in its infancy in China, and MR is well poised to benefit from an expanding market. MR specializes in patient monitors, diagnostic lab equipment, and anesthesia & ultrasound machines. Earlier in 2008 MR acquired a U.S. patient monitoring business from Datascope (DPM). MR is currently in the process of integrating DPM’s operations; it will likely take 1.5 to 2 years for the full synergies of this deal to be unlocked. Nonetheless, unlike MR, DPM’s sales were mostly targeted around hospitals in the U.S. and Europe, this should prevent most sales cannibalization, and give MR good exposure to new markets and technologies. This acquisition adds significant upside potential to MR’s future growth potential. Looking at the immediate impact, MR just received FDA approval for DPM’s next generation AS3000 anesthesia delivery system, which is a strong entry into a USD250mn a year market. On the home front, MR has been partially supported by public healthcare reforms, and an initiative to provide medical equipment to rural hospitals; this trend will likely not let up anytime soon. Additionally, MR’s robust pipeline should continue supporting the companies bottom line. MR’s pipeline includes digital radiography equipment, a digital defibrillator, and various other patient monitoring and chemical analysis equipment. The digital radiography system is a high-res X-Ray machine utilizes digital vs. traditional film, allowing for simpler analysis and digital storage. I see significant upside for MR given its strong domestic position, and growing international presence. This together with stronger medical device demand in China, a successful integration with DPM, and its innovative product line MR should continue to experience strong growth for the foreseeable future. (Expected Q208 Earnings Report 8/20/08)

Events which could improve outlook:

  • Exceeding 2008’s company guidance of USD560-580mn in revenues and USD132-134mn for income.

  • Successful integration of DPM, with stronger than anticipated synergies (i.e. cross-selling)

  • Stronger domestic and international demand for MR’s product line.

Events which could deteriorate outlook:

  • Higher costs and potential FX risk.

  • Increased competition in both the domestic and foreign markets.

  • Changes in government policy reducing domestic sales or prices.

MR vs. Hang Seng

Source: Bloomberg

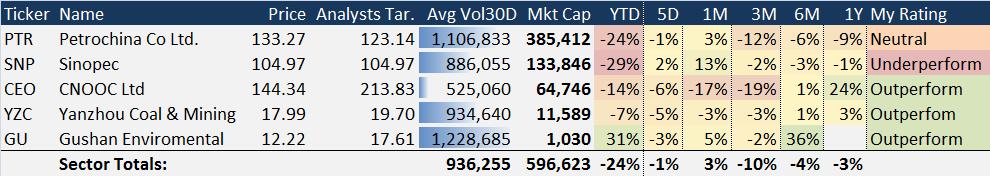
China Medical Technologies (CMED, Outperform): China Medical Technologies, Inc. is a medical device company that develops, manufactures, and markets products using high intensity focused ultrasound, or HIFU, for the treatment of solid cancers and benign tumors in China. (Bloomberg)

CMED’s outlook in a nutshell: CMED has a unique characteristic when it comes to Chinese healthcare companies; it is the only company in China certified to conduct FISH testing. FISH testing (fluorescence in situ hybridization) is a genetic test that can detect chromosome abnormalities, and can be used prenatally to detect Down’s syndrome among other genetic conditions. Given CMED’s currently monopoly and China’s untapped potential, this segment should help support CMED in both the short and long term. CMED’s other primary segments include ECLIA (electrochemiluminescence immunoassay) and HIFU (high intensity focused ultrasound). These segments should also continue to demonstrate growth, but at a slower pace than the company’s FISH business. It is expected CMED will be granted further approvals by the SFDA that will permit it to increase FISH advertising, and and widen the scope of the testing. Additionally, we seen significant improvements in the company’s margins, primarily due to an increased emphasis on high margin reagent products, and limiting the sale of low margin equipment, such as microscopes. This strategy has led to a non-GAAP margin increase to 79.1% from 72.3% for 1Q08 vs. 1Q07; I anticipate this growth rate will moderate, yet remain slightly above current levels. Recently, the company initiated a new business model where by it gives free ECLIA equipment to new customers, who in turn end up purchasing high-margin reagent products to operate the machine. In the short-term this may add some pressure onto CMED’s bottom-line, but will be more than offset via longer-term reagent sales. All in all, I believe CMED is a great play in the Chinese healthcare industry given its unique position regarding the FISH test, and new strategy emphasizing higher margin products. (1Q08 Earnings Report 8/04/08 Est: 0.52 Act: 0.42)

Events which could improve outlook:

  • Further SFDA approvals for new FISH probes.

  • Continued growth in company margins.

  • Reaching or exceeding expectations of 500 hospitals with FISH capabilities by the end of 2008.

Events which could deteriorate outlook:

  • Increased competition.

  • Lower than anticipated FISH sales.

  • Changes in government policy adversely affecting the sector.

CMED vs. Hang Seng

Source: Bloomberg

Wuxi PharmaTech (WX, Neutral): WuXi PharmaTech Cayman Inc. provides pharmaceutical and biotechnology research and development outsourcing. The Company’s services include discovery chemistry, service biology, analytical, pharmaceutical development, and manufacturing. (Bloomberg)

WX’s outlook in a nutshell: While the CRO business should remain robust in China, WX’s recent acquisition of AppTech, a biologics manufacturing company raises some concerns. WX is a market leader in China’s CRO industry, and this portion of its should remain strong over the next several years. In fact, on June 24th 2008 WX announced a memorandum of understanding to create a 50-50 joint venture for contract research with Covance. The joint venture will be located at WX’s Suzhou facility; specific financial terms are expected to be released once the deal is complete. This deal should help bolster WX’s CRO business over the next several years. However, WX’s USD169mn acquisition of U.S. based Apptech add a cloud of uncertainty over the company’s overall outlook. It is likely this deal will create significant cost pressures, and lead to higher earnings variance due to the volatility of biologics manufacturing. All in all, given the recent Apptech acquisition and the potential for increased costs and compressed margins we do not see much upside potential for WX. (Expected Q208 Earnings Report 8/13/08 Post-market)

Events which could improve outlook:

  • Strong demand for biologics manufacturing.

  • Significantly higher CRO business in China.

  • Streamlined integration of Apptech combined with successful cross-selling initiative.

Events which could deteriorate outlook:

  • Increased costs from Apptech acquisition.

  • Decrease in biologics demand.

  • Slow-down in CRO business

WX vs. Hang Seng

Source: Bloomberg

Simcere Pharmaceutical (SCR, Neutral): Simcere Pharmaceutical Group manufactures and supplies branded generic pharmaceuticals to the China market. The Company’s products include antibiotics, anti-cancer medications and anti-stroke medications. (Bloomberg)

SCR’s outlook in a nutshell: SCR and the Chinese generic drug sector in general face strong competition. SCR’s sales suffered in Q208, primarily due to shifting to a lower margin sales model in the face of potential competition. I expect SCR will continue to face growing competition in many of its existing lines, further compressing margins. Nonetheless, SCR has at least one first-to-market generic expecting approval during 2H08, which could help bolster sales and sustain margins. Given China’s untapped potential in the healthcare industry, SCR should continue experiencing sales growth in its generic markets. SCR will likely continue to target the large potential in small & medium sized hospitals and pharmacies, which should help sales volumes. Nonetheless, increased volumes may not be enough to off-set the impact of lower prices in an environment of increased competition. Looking at 1Q08 we can already see some of the potential impact on margins. Furthermore, a SCR competitor that manufactures a Yidasheng rival, is selling its drug slightly below Yidasheng’s current price, which could lead to further pricing pressure. SCR noted on its 2Q08 earnings call that it is considering acquisitions given its strong cash base. All in all, despite the fact that we believe SCR’s sales volume will continue to expand, it will likely be at least partially off-set by lower prices due to increased competition. (2Q08 Earnings Report 8/05/08 Est: 1.44 Act: 1.48)

Events which could improve outlook:

  • Stronger than anticipated drug sales.

  • Competitors bringing rival drugs onto market slower than expected

  • Approval and eventual ability to market drugs in SCR’s pipeline including Biapenem, Palonosetron, Iguratimod, and Levamisole.

  • Any significant acquisition that could improve SCR’s bottom line.

Events which could deteriorate outlook:

  • Continued pricing pressure from competitors.

  • Lower than anticipated drug sales.

  • Rejection of drugs in SCR’s pipeline.

  • Any government regulation regulating drug costs.

SCR vs. Hang Seng

Source: Bloomberg

3SBio (SSRX, Outperform): 3SBio, Inc. is a biotechnology company. The Company researches treatments in the areas of nephrology, oncology, supportive cancer care, inflammation, and infectious diseases. (Bloomberg)

SSRX’s outlook in a nutshell: SSRX is a growing company in a Chinese growth sector. SSRX’s two main products are EPIAO and TPIAO, experienced record sales increases in 1Q08 of 42% and 104%, respectively. EPIAO is an EPO drug, which helps stimulate the body’s red blood cell production that can be prescribed to patients with anemia, or who are undergoing chemo-therapy. According to the company, in Europe roughly 17% of chemo-patients are prescribed EPO, while in China the ratio stands at 2%, implying significant growth potential. TPIAO is a THPO treatment, which increases the body’s production of platelets; this drug can also be prescribed to oncology patients. Looking ahead SSRX has a potentially strong pipeline, with its high dosage EPIAO treatment and second generation IL-2 treatment, both finishing Phase III trials. SSRX expects to file with the SFDA regarding both these drugs during 2H08. By the end of 2008, SSRX also intends on filing with the SFDA in order to be granted permission to use TPIAO as a treatment for ITP, a bleeding disorder. Management expects to continue investing heavily into the company’s core business, increasing sales force and expanding capacity. Despite the potential for rising costs due to managements expansion plans, I foresee SSRX further penetrating China’s oncology market while maintaining strong and stable margins. All in all given SSRX’s growth and future pipeline, I believe SSRX is a good play in the Chinese healthcare industry. SSRX is a growth company with a management team who appear to be making wise investment decisions towards long term sustainable growth. Interesting to note is that SSRX has the right to buy-back company shares through March of 2009. Lastly, I expect the company could upwardly revise its 2008 guidance during its Q208 earnings call, this of course depending on 2Q results. (Expected Q208 Earnings Report 8/12/08 Post-market)

Events which could improve outlook:

  • Improved 2008 company guidance.

  • Stronger than anticipated EPIAO & TPIAO sales.

  • Approval of new treatments by the SFDA.

Events which could deteriorate outlook:

  • Strong competition from other market players, which could reduce market share or add pricing pressures.

  • Any pipe-line drugs failing to get approval from the SFDA.

  • Higher than anticipated costs reducing margins.

SSRX vs. Hang Seng

Source: Bloomberg

Tongjitang Chinese Medicine (TCM, Neutral): Tongjitang Chinese Medicines Co. is a pharmaceutical company. The Company develops, manufactures and markets modernized traditional Chinese medicines. (Bloomberg)

TCM’s outlook in a nutshell: I am hesitant on TCM’s outlook for several reasons 1) nearly 80% of TCM’s revenue comes from its Xianling Gubao product alone, which is used to treat osteoporosis; 2) the traditional Chinese medicine industry is extremely competitive; & 3) canceling its privatization due to what was reported as a deteriorations in the credit market. All in all, if it were not for this equities recent sell-off after the cancellation announcement I would have rated them ‘underperform’, but given the sell-off and challenges the company still faces I don’t see much upside or downside for TCM.

Events which could improve outlook:

  • Higher than expected earnings.

  • Re-initiating privatization.

  • Creating a more robust product base.

Events which could deteriorate outlook:

  • Slower than anticipated sales of Xianling Gubao.

  • Earnings below expectations.
TCM vs. Hang Seng
Source: Bloomberg

Chinese Financial Sector ADRs

1 Comment

As a follow-up to my energy sector ADR piece I am going to take a look at the Chinese and Hong Kong Financial sector ADRs. There are 3 Chinese and Hong Kong ADRs within the GICS financial sector: China Life Insurance (LFC), E-House (EJ), and Xinyuan Real Estate (XIN).

Chinese & HK Financial Sector ADRs

Source: Bloomberg

The Companies:

China Life Insurance (LFC, Outperform): China Life Insurance Co., Limited offers a wide range of life, accident, and health insurance products and services. LFC is the largest life insurance provider in China. (Bloomberg)

LFC’s outlook in a nutshell: Several factors have gone into LFC’s poor ytd performance, including large potential payments due to the Sichuan earthquake and poor overall market performance. But in retrospect, it does not appear Sichuan earthquake related payments will be as high as some analyst had anticipated. In fact, it appears the Sichuan earthquake may have increased demand by Chinese consumers for life insurance related products; this should help bolster LFC’s premium growth through-out 2008. Recently, it was estimated that LFC’s life insurance premiums increased 50% during the first 5 months of 2008. Based on continued strong demand and LFC’s vast potential client base and large distribution network, especially in rural China; I expect strong premium growth to be supported for the foreseeable future. Nonetheless, LFC could face some downward pressure from its investment business and the possibility of compressed new business margins due to the increased sale of single-premium products vs. regular premium. Investment income could also be affected this year by a recent rule preventing insurance companies from guaranteeing Chinese corporate debt. The Chinese government has also recently introduced new solvency rules for the insurance industry. The new solvency rule break insurance companies into three categories based on their solvency margins, insolvent (<100%),>150%). The good news is as of Dec. 2007 LFC’s solvency margin was over 5x the government minimum, so we expect the regulations to have minimal short-term business impact. All in all I believe strong demand for insurance products coupled with the under-development of the Chinese insurance industry and LFC’s strong distribution network, LFC could see some considerable upside in the future. (Expected Q208 Earnings Report 8/25/08)

Events which could improve outlook:

  • Continued premium growth through the second half of 2008.

  • Strong performance of Chinese equity markets.

  • Higher than anticipated investment yields.

Events which could deteriorate outlook:

  • Slow-down in premium growth and/or tightening margins.

  • Poor equity market performance.

  • New government regulation affecting LFC’s bottom line.
LFC vs Hang Seng
Source: Bloomberg

E-House (EJ, Outperform): E-House China Holdings Ltd. offers real estate services. The Company offers primary real estate agency services to residential real estate developers; lists and brokers properties for resale; and offers land acquisition consulting and property development consulting services. (Bloomberg)

EJ’s outlook in a nutshell: The Chinese real estate sector has been facing significant downward pressure. Unlike the US however, the primary catalyst for this adjustment is derived from escalating government restrictions targeting the sector. These regulations include everything from restrictive lending policies to quotas for land development. (Click here for a more comprehensive list) Consequently, the performance of all real estate related equities has suffered including EJ. Nonetheless, despite this EJ was still able to post solid 1Q08 numbers beating analysts’ estimates, demonstrating 107%yoy revenue growth. Looking ahead to 2Q08 earnings EJ has affirmed its revenue projections of between USD41mn to USD44mn, or a roughly 75% increase from the year prior. We believe that EJ is also in a relatively good position for the remainder of 2008 for the following reasons: 1) Continued growth in EJ’s real estate consulting and information services segment. This should be driven by EJ’s leading market position in the real estate consulting service industry and by subscriptions to EJ’s innovative CRIC information database; 2) Developers demand for increased cash flow and sales turnover should help sustain revenues and growth for EJ’s primary real estate agency services, which could also lead to further developer alliances. Given current conditions it is also likely some developers are holding off some projects until the end of 2008, which could help 2H08 earnings for EJ, or at least indicate a potential turn-around for the sector; & 3) A potential loosening of restrictive government policies related to the real estate sector. The recent slowdown in economic growth will likely cause the Chinese government to reconsider certain restrictions placed on the sector to help bolster domestic growth. Based on analysts’ earnings projections and our back of the envelope discounted free cash flow model we believe a target price of $18.00-$20.00 would be a fair value for EJ. Regardless of the current conditions in the Chinese real estate industry, we believe EJ is well positioned for growth and is a good play in the Chinese financial sector ADR universe. (Expected Q208 Earnings Report 8/20/08 Pre-market)

Events which could improve outlook:

  • Government easing restrictions related to the real estate sector, especially leading to easier credit.

  • Increased consulting fees or higher than expected subscriptions to the CRIC system.

  • Growth in home prices and/or real estate transactions.

  • Announcing additional alliances with developers.

Events which could deteriorate outlook:

  • Further government restrictions in the real estate sector

  • Lower than expected consulting fees and CRIC subscriptions

  • Missing 2Q08 earnings target of USD41 – USD44mn or 2008’s, which could put in question 2008’s full year target of USD210mn to USD240mn.

EJ vs. Hang Seng
Source: Bloomberg

Xinyuan Real Estate (XIN, Neutral): Xinyuan Real Estate Company, Ltd. is a residential real estate developer that focuses on Tier II cities in China. The Company develops large scale residential projects that include multi-layer buildings, sub-high apartment buildings, hospitals, schools, and others. Xinyuan also develops small scale properties as well. (Bloomberg)

XIN’s outlook in a nutshell: Due to credit restrictions and other policies aimed at real estate developers we believe XIN will remain under pressure for the rest of 2008. Nevertheless, XIN primarily focuses on tier II Chinese cities with projects primarily centered in Chengdu, Zhengzhou, Hefei, & Jinan. On average these cities have fared better than tier 1 cities in terms of slowing home price growth and diminishing demand. However, while year over year housing prices remain positive in these cities, we have begun to see a significant slow-down in recent data. June’s yoy housing price growth in Chengdu and Zhengzhou has slowed by -19.6% and -10.0%, respectively, from the month prior. The drop-off in demand for housing will likely continue to strain prices and sales in XIN’s target markets. However, any pro-real estate shifts in government policy that would bolster demand (i.e. increase credit), could have a significant impact in XIN’s business. XIN like many developers are likely in a wait in see mode when it comes to future expansion plans. We believe given the current stress on the Chinese real estate industry, and XIN’s front-line position we would prefer waiting for clear indications of the sectors recovery before considering an investment. We anticipate having a clearer picture of the Chinese real estate developer landscape by the end of 2008.

Events which could improve outlook:

  • Government easing restrictions related to the real estate sector, especially leading to easier credit

  • Strong sales on current projects.

  • Recovery in real estate transaction volume combined with stable or rising housing prices.

Events which could deteriorate outlook:

  • Further restrictions on credit availability.

  • Rising construction costs on current projects.

  • Deterioration of sales on current projects.

  • Continued slow-down of housing price growth in target cities.

XIN vs. Hang Seng
Source: Bloomberg

Chinese Government policies on real estate sector (Supplement)

This is a working list of Chinese government policies aimed at stemming growth in the Chinese real estate sector. Please feel free to comment if there is something I am missing. A major source for this was E-House’s annual report.

The following regulations were put in place in 2003:

  • Real estate developers are required to internally finance 35% of the total projected capital outlays for new developments vs. 20% previously.
  • Monthly housing expenses, which include mortgage payments and property service fees, cannot exceed 50% of the borrowers’ monthly income. Additionally, borrowers’ total debt servicing payments cannot exceed 55% of total income.
  • The government also tightened regulations around mortgage lending and restricted the approval of areas for new developments.


The following additional regulations were put in place in 2006:

  • 70% of land approved for residential development for any year must be used to develop low to medium and small to medium sized unites and low cost rental policies.

  • 70% of any construction which commenced on or after June 1st 2006 within each city or county consists of units with floor areas of less than 90 square meters.

  • The minimum down payment for the purchase of any property over 90sqm was increase to 30% of the purchase price vs. 20%.

  • A business tax was put in place for re-selling properties held for less than 5 years.


The following additional regulations were put in place in 2007:

  • Down payments for first time home owners buying properties larger than 90sqm were increase to 30% from 20%.

  • Minimum down payment for second-time home owners were increased to 40% and the minimum home mortgage rate was set at 110% of the benchmark index.

  • On the commercial real estate front, banks are not permitted to finance purchases of pre-sold properties, minimum down payment was increased to 50%, minimum interest rate of 110% of benchmark, and loans can be for no more than 10 years. At the same time, banks are permitted some flexibility based on its own risk assessments.

  • Minimum down payments for dual listed residential/commercial properties were increased to 45%.


The following additional regulations were put in place in December 2007:

  • The National Development and Reform Commission and the Ministry of Commerce issued a new regulation, effective Dec 1, 2007, which placed real estate brokers and agencies in a restricted category of foreign investment industries.

  • Credit curbs were put in place to cap total lending for 2008 at RMB3.6trn, matching the previous year’s level.

Chinese Energy Sector ADRs

The first sector I am going to break-out is the Chinese energy sector, primarily because this sector has the highest market cap of all the sectors I outlined in my last piece. There are 5 Chinese and HK ADRs withing the energy sector: PetroChina (PTR), Sinopec (SNP), CNOOC (CEO), Yanzhou Coal Mining (YZC), and Gushan Environmental Energy (GU).

Chinese & HK Energy Sector ADRs

Source: Bloomberg, analyst targets are an average provided by Bberg &for reference only

The Companies:

PetroChina (PTR, Neutral): PetroChina Company Limited explores, develops, and produces crude oil and natural gas. The Company also refines, transports, and distributes crude oil and petroleum products, produces and sells chemicals, and transmits markets and sells natural gas. All of PTR’s oil and gas production and reserve facilities are located within China. (Bloomberg)

PTR’s outlook in a nutshell: China’s continued strong economic growth should support increased demand for natural gas and petroleum products. However, domestic production of crude oil and natural gas has not and will not be able to keep up with the demand for refined energy products. This means PTR and other energy companies will have to rely more heavily on imported energy products. Currently, China imports roughly 50% of its crude oil, and we anticipate this percentage will rise, as China is now a net importer of oil. One of the catalysts behind the pickup of energy imports is the government’s oil tax rebate which rebates 75% of the 17% VAT tax on crude imports, and a full discount on the importation of gas and diesel. Currently, it appears this discount will stay in place through 3Q08, but it will be important to watch. It is likely that without these imports China could face more significant domestic energy shortages. All in all we believe that PTR’s margins will continue to come under pressure, and the ADR has limited upside, especially verses other ADR plays. With this said however, we believe PTR is in the better position than SNP. The reason being PTR holds the majority in both domestic crude oil and natural gas production. (Expected Q208 Earnings Report 8/21/08)

Events which could improve outlook:

  • Slowdown in global oil prices.
  • Increase in domestic price caps in gas.
  • New oil field discoveries.

Events which could deteriorate outlook:

  • Sharp rise in global oil prices.
  • End to energy import tax rebate.
  • New or stronger government regulations which could increase PTR’s cost.

PTR vs. Hang Seng

Source: Bloomberg

Sinopec (SNP, Underperform): China Petroleum and Chemical Corporation (Sinopec) explores for and produces crude oil and natural gas in China. The Company also owns refineries that make petroleum and petrochemical products such as gasoline, diesel, jet fuel, kerosene, ethylene, synthetic fibers, synthetic rubber, synthetic resins, and chemical fertilizers. In addition, Sinopec trades petrochemical products. SNP is currently China’s largest oil refiner. (Bloomberg)

SNP’s outlook in a nutshell: Like PTR, Sinopec is expected to face difficultly due to high oil prices compressing margins. Unlike, PTR however, SNP is much more vulnerable to the current government tax reductions for crude importation; SNP currently imports roughly 80% of the crude oil it refines. Good news for SNP is that it appears the VAT reductions should remain in place through Q3, but any changes to that could significantly impact SNP’s bottom line. Even with the recent drop in WTI prices it has been reported by company officials by the Xinhua news agency that the company’s break-even point is a WTI price of around USD80, far below current levels. Given this pricing pressure I see limited upside for SNP. It is also hard to predict what type of government intervention may take place to support the local energy industry, given this unknown it is an area I would like to avoid. (Expected Q208 Earnings Report 8/25/08)

Events which could improve outlook:

  • Slowdown in global oil prices.
  • Increase in domestic price caps for refined products.
  • Greater expansion at its Tahe oil-field.
  • New oil-field discoveries bolstering E&P earnings

Events which could deteriorate outlook:

  • Further drop in refining margins.
  • Any changes to reduce the magnitude or length of the VAT subsidies.
  • New or stronger government regulations which could increase PTR’s cost.

SNP vs. Hang Seng

Source: Bloomberg

CNOOC (CEO, Outperform): CNOOC Limited, through its subsidiaries, explores, develops, produces, and sells crude oil and natural gas. (Bloomberg)

CEO’s outlook in a nutshell: Unlike PTR & SNP, CEO has significant exposure to E&P, which in a period of high oil prices should add considerably to the bottom line. At the same time, CEO has recently started production at its Xijuan 23-1 oil field and has numerous more scheduled to go online during the remainder of 2008. This should help CEO reach their roughly 15% production increase from last year. All in all, in the current oil piece environment, and with numerous projects already or nearly ready to go online we believe CEO is a good play in the Chinese energy sector. (Expected Q208 Earnings Report 8/27/08)

Events which could improve outlook:

  • Higher international oil prices.
  • New oil and/or gas discoveries could improve CEO’s long-term outlook
  • Better than expected production especially at newly operational Xijian 23-1 oil field or others scheduled to come on line this year.

Events which could deteriorate outlook:

  • A significant drop in global oil prices
  • Not reaching 2008’s target production growth.
  • Increased costs which could impact the bottom line.

CEO vs. Hang Seng

Source: Bloomberg

Yanzhou Coal Mining (YZC, Outperform): Yanzhou Coal Mining Company Limited operates underground mining and coal preparation and operation businesses. Its products are sold in domestic and international markets. The Company also provides railway transportation services. (Bloomberg)

YCZ’s outlook in a nutshell: Like its oil and gas counter parts YZC is susceptible to Chinese government price control policies. Despite this coal prices have remained elevated and this should benefit YCZ’s bottom line. Looking at YZC’s 1Q08’s earning release it would appear that YCZ has begun to shift its focus to producing coking coal vs. thermal coal, which has helped company margins. WE believe this trend will continue for the following reasons: According to a Wall Street Journal article coking coal, unlike thermal coal, isn’t effected by recent government price caps. At the same time the article quotes UOB Kayhian analyst Karen Li as saying, “We are bullish on China’s coking-coal sector because of the current tight-market-supply situation.” YZC saw profits from coking coal exceed that of thermal coal for the first time in 2007. Addtionally, YZC owns a majority stake in a new methanol project, which is scheduled to begin production this year. The operation will use thermal coal to produce ethanol, with the first deliveries being made in 2H08. All in all, factoring out any potential government intervention further regulating coals prices or impacting YZC’s cost, we believe YZC is a good play in the Chinese energy market. (Expected Q208 Earnings Report 8/15/08)

Events which could improve outlook:

  • Continued strength in coal prices.
  • Further shift into higher margin coking coal.
  • Success of methanol project and increased coal production at plants in operation.

Events which could deteriorate outlook:

  • Weakening in coal prices.
  • New Government policies restricting coal prices or export quotas.
  • Transportation issues regarding coal delivery.

YZC vs Hang Seng

Source: Bloomberg

Gushan (GU, Outperform): Gushan Environmental Energy Limited produces biofuel. The Company produces biodiesel and by-products of biodiesel production, including glycerin, plant asphalt, erucic acid and erucic amide. (Bloomberg)

GU’s outlook in a nutshell: GU essentially turns waste oil into bio-diesel, and they do this rather successfully. In fact 1Q08 saw impressive increases in net income and revenue. This was primarily due to higher sales volume and prices. For the remainder of 2008 June’s diesel fuel price increase, and any future increase, should help benefit GU’s margins. Additionally, GU has started selling its bio-diesel product to the chemical industry, which according to the company sells at an average RMB800 premium over sales to the diesel industry. In 1Q08 this accounted for 10% of total sales volume; the company expects this could reach 30% by the end of 2008. GU also has numerous ongoing projects to increase bio-diesel production, which is expected to total 400tons by the end of 2008 vs. 240tons in 2007. GU’s Shanghai plant began operations in June while Beijing’s plant became operational in January and is expected to double capacity in 4Q08. Moreover, two new plants are expected to become operational during that time period. It is anticipated that GU will announce 2009’s expansion plans during 2Q08’s conference call on August 11th. According to company officials all expansion is being paid for through cash on hand and cash flows without the use of leverage. Costs increased somewhat significantly for GU in 1Q08 due to higher than expected inflation caused by the Sichuan earthquake, but more recently costs have begun to moderate as Chinese inflation growth has slowed. Moreover, GU’s proprietary technology allows them to use lower quality waste oils than their competitors giving them a cost advantage in the sector. On average GU expects input costs to increase roughly in-line with the Chinese inflation rate. All in all given the current demand and potential shortages for diesel combined with GU’s entrance into the chemical market; we are optimistic about the company’s future, and believe the company could have significant upside. This is my favorite play in the Chinese ADR energy sector. (Expected Q208 Earnings Report 8/11/08)

Events which could improve outlook:

  • Increases in the governments diesel fuel price cap
  • Larger volumes being sold into the higher margin chemical industry.
  • Meeting production targets and bringing new plants online within the targeted time frame.

Events which could deteriorate outlook:

  • Significant rise in input prices effecting margins.
  • Drop off in business to the chemical industry.
  • Supply chain issues on sourcing waste oils.
GU vs. Hang Seng
Source: Bloomberg

A Look at Chinese and Hong Kong ADR’s

1 Comment

In this piece I highlight 66 Chinese and Hong Kong ADRs by sector, broken out by market cap, average 30 day volume, and a series of performance metrics. This piece will eventually be followed-up with specific analysis on Chinese sectors and companies. Before getting to the nitty gritty lets formulate a quick outlook on the global and Chinese economies.

As everyone by now has realized decoupling of the financial markets holds less credibility than the Loch Ness monster. This notwithstanding, I anticipate growth in developing emerging market economies, especially China, will continue to outpace their industrialized counter parts in the years to come, albeit it not at the pace we have grown accustomed to seeing. It is also very likely we will see domestic demand take over as the new engines of growth in these economies. The cause is simple, industrial nations, particularly the US, will experience slowdowns in consumption, hence overall growth over the next several years as wealth continues to deteriorate. The effect, less demand for foreign goods will likely cause trade balances to become a drag on growth for many EM export oriented economies On the other hand, this should be at least partially off-set by what I expect to be continued strong growth in the domestic sector. Domestic Consumption and investment should remain robust for many EM countries after experiencing high growth and a developing domestic economies.

With that said lets look at China, where the global slow-down coupled with an appreciating currency is a double whammy for exports. But how has the Chinese domestic market performing? In a nutshell the answer is good. According to China’s 2Q08 GDP figures domestic investment and consumption continue to experience significant growth. In fact, the June retail sales figure demonstrated 23%yoy growth. So why have Chinese equities faced such a bad year? Well I don’t believe there is any one specific reason for this, but a combination of factors including fears of monetary tightening, investors’ flight to quality, and liquidity issues in the global financial sector stemming from the housing crisis. I anticipate that as fears ease and liquidity returns to the market we could see a significant buy-back of Chinese equities. Additionally, as the Chinese export sector continues to deteriorate there is a growing possibility we could see a pull-back of domestic macro-policies aimed at preventing the over-heating of the domestic economy. This could include anything from increasing loans quotas to reducing reserve requirements. With this said, in the long-run I am bullish on the Chinese domestic sector, while slightly bearish on export oriented industries. There are of course risks, and I advise you to read some of my previous posts and other research. I will go into further detail on sectors and companies in future posts. Now let’s look at the ADRs:

Year to date the 66 Chinese and Hong Kong ADRs I tracked lost 24.0% of their value in market weighted terms, significantly outperforming the domestic Shanghai SE Composite Index which returned -45.6% during the same period, but underperforming Hong Kong’s Hang Seng Index which returned -18.4%. The best performing company was China’s VisionChina Media (VISN) which returned 167.1%ytd, while the worst performer was Hong Kong’s Corgi International (CRGI) which lost 73.0% during the same time period. Interesting to note is that in 2007 nearly 70% of Corgi’s revenues were derived from the US. The best performing GICS sectors for the ADRs were consumer discretionary, health care and IT which all lost 15%ytd in market weighted terms. The worst performing sector has been industrials, which lost 54%ytd. Please look at tables below for further details:

ADR’s sorted by Sector & Market Cap*

*Sector Performance is Market Cap Weighted

Source: Bloomberg

To be continued…


Quick Description from Bloomberg of top 10 ADRs by Market Cap

  1. PetroChina (PTR): PetroChina Company Limited explores, develops, and produces crude oil and natural gas. The Company also refines, transports, and distributes crude oil and petroleum products, produces and sells chemicals, and transmits markets and sells natural gas.
  2. China Mobile (CHL): China Mobile Limited, through its subsidiaries, provides cellular telecommunications and related services in the People’s Republic of China and Hong Kong SAR.
  3. China Petroleum & Chemical (SNP): China Petroleum and Chemical Corporation (Sinopec) explores for and produces crude oil and natural gas in China. The Company also owns refineries that make petroleum and petrochemical products such as gasoline, diesel, jet fuel, kerosene, ethylene, synthetic fibers, synthetic rubber, synthetic resins, and chemical fertilizers. In addition, Sinopec trades petrochemical products.
  4. China Life Insurance Company (LFC): China Life Insurance Co., Limited offers a wide range of life, accident, and health insurance products and services.
  5. CNOONC (CEO): CNOOC Limited, through its subsidiaries, explores, develops, produces, and sells crude oil and natural gas.
  6. China Telecom (CHA): China Telecom Corporation Limited, through its subsidiaries, provides wire line telephone, data, and Internet, as well as leased line services in China.
  7. China Unicom (CHU): China Unicom Limited, through its subsidiaries, provides telecommunications services in the People’s Republic of China. The Company’s services include cellular, paging, long distance, data, and Internet services.
  8. Aluminum Corporation of China (ACH): Aluminum Corporation of China Limited is a producer of alumina and primary aluminum in China. The Company refines bauxite into alumina and smelts alumina to produce primary aluminum.
  9. China Netcom (CN): China Netcom Group Corporation (Hong Kong) Limited is a fixed-line telecommunications operator in China and an international data communications operator in the Asia-Pacific region. The Company provides broadband and other Internet-related services, including DSL and LAN services, business and data communications.
  10. Yanzhou Coal Mining (YZC): Yanzhou Coal Mining Company Limited operates underground mining and coal preparation and operation businesses. Its products are sold in domestic and international markets. The Company also provides railway transportation services.

**Disclaimer: Author holds long positions in China Mobile(CHL) & EHouse (EJ)

Impending Chinese Financial Crisis…

1 Comment

Sitting here in Hong Kong, I know few people who aren’t transferring money into China to take advantage of the appreciating RMB and attractive domestic rates. In fact a study conducted by the Chinese Academy of Social Sciences estimates there could be over USD1.0trn of such money within China, with USD150bn coming during the first five months of 2008. The good news for these investors is that the RMB is still expected to appreciate over the next 1 to 2 years as the Chinese government continues to correct economic imbalances. However, there is bad news. Eventually, the RMB appreciation will peak, and those investors’ solely within the country to take advantage of the appreciating currency will begin to pull-back. This will likely cause liquidity problems within the Chinese economy, and will lead to further depreciation as more investors attempt to withdraw their funds. This potential crisis has not gone unnoticed. *The branch head of the Jiangsu province China Banking Regulatory Commission released in a paper this week the following comments;

“The initial judgment is that China’s financial crisis will kick off between 2009 and 2010, though it may be a year or two later, and will be triggered by a turning point in yuan appreciation…”

“By that time, international capital will flow out instead of coming in and the yuan will face depreciation instead of appreciation pressure. China will face a liquidity shortage and financial crisis will therefore follow.”

In fact looking at the RMB NDF rates, we can see that the market is currently pricing in a slight RMB depreciation around the 3-year time horizon (chart below). In fact, back in May we even saw the 1-month contract briefly imply depreciation for the RMB, demonstrating the potential volatility of the market. This notwithstanding, we have begun to see the growth rate of Chinese exports slow, a trend we expect to continue. This coupled with an unwavering demand for imports, will place a stronger weight on the domestic sector to support China’s growth. To make matters worse for the export sector the Chinese government has initiated new capital controls to reduce the amount of ‘hot money’ that may be hidden within the sector (i.e. through over-invoicing). Some estimates have placed the amount of hot money hidden within the sector at around 2% of exports. The good news is that the increased importance of the domestic market within China could cause the government to reduce some restrictions on the sector, meant to reduce over-heating within the economy. Yet, a conundrum could arise if Chinese inflation rates once again begin to accelerate. However, at this point most analysts’ estimates are calling for inflation to slow.

The Current RMB NDF Implied Rates show the RMB Depreciating Slightly in 3-Years

Source: Bberg

The bottom line is that China is facing a potential financial crisis that could occur sometime over the next 2 to 4 years. I will continue to look at the RMB NDF market and changes to the government’s foreign exchange policy as potential forward looking indicators to this crisis. In the meantime, the slow-down in Chinese exports will likely have 2 short term effects, 1) a decelerated RMB appreciation, & 2) the potential for authorities to lift some regulations put in place to prevent the domestic economy from over-heating. This could have positive effects on the local equity markets, after facing significant losses from their previous highs. In fact, last week we already began to see the local equity markets respond favorably to the possibilities of less stringent economic policies.

*http://www.quamnet.com/newscontent.action?articleId=889534

A Quick Look at the Asian CDS Market

2 Comments

Recently, I have been attempting to locate data on the Asian credit default swap (CDS) market, specifically on sovereign protection; I couldn’t find much. In response I decided to put together this posting, which tracks performance and allows for some basic relative value and correlation analysis verse equity markets. All CDS prices quoted in this entry are 5yr protection on each governments’ international bonds.

A credit default swap is an agreement between two parties, in which one party pays a premium to the other party, who in return provides protection against the default of an underlying bond. A CDS can be written or bought by anyone, even if they do not own the underlying bond. Since the price of the CDS is the amount a buyer is willing to pay for protection against a potential default it goes without saying that the price is a good measurement of market implied risk. This also means there should be some correlation between sovereign ratings and the sovereign CDS prices.

To start, let’s take a look at the three major rating agencies rating systems. The chart below breaks out each of the major rating companies systems, with the green area representing investment grade ratings and the red area representing non-investment grade ratings. I have also included the credit ratings of the Asian countries for each of the 3 agencies (see below).

Moodys, S&P, & Fitch Credit Ratings

Asian Countries Credit Rating

Next, I created a composite rating system for the countries being analyzed. To do this I assigned number values to the above rating system with the highest rating for each agency equaling 1, and the lowest rating equaling 21. In the case an agency had a positive outlook for any given country I subtracted 0.5 from their score (i.e. a S&P rating of AA would equal 3, but an AA rating with a positive outlook would equal 2.5). I then averaged these results together for each country and created the consolidated rating (see chart below).

Composite Asian Credit Ratings

You can see from the chart above that for each country, except Vietnam, current CDS prices correspond well to each countries composite credit rating. The next step is to look at each countries CDS performance to determine shifts in implied market risk, especially given the current credit crisis and large equity sell-offs.

Historical 5yr CDS Japan, Hong Kong, & China

Hong Kong – China 5yr CDS Spread

Source: Bberg

Over the past couple of months CDS prices in Hong Kong and China have seen a significant rise, this corresponds to the recent equity sell-off in both countries. Japanese CDS prices also rose, but remained somewhat contained compared to Hong Kong and China. It is important to highlight that year to date the Nikkei 225 is down 14.86% verse 23.70% & 46.5% for the Hang Seng and Shanghai indices, respectively. Recently, we have witnessed significant volatility between the Hong Kong and Chinese 5yr CDS spread; nevertheless the spread has begun to revert back to its historical average of around 12bps.

Historical 5yr CDS Korea, Malaysia, & Thailand

Source: Bberg

Similar performance can be seen for 5yr CDS in the Korean, Malaysian, and Thai markets. Generally speaking we have seen the spreads between Thailand, Malaysia and Korea moving tighter during the recent volatility.

Historical 5yr CDS Philippines, Indonesia, & Vietnam

Source: Bberg

Finally, and possibly most interesting we have seen 5y CDS move significantly higher in Vietnam. This comes despite the fact that over the past several years the spread between 5yr Vietnamese CDS and that of Indonesia and the Philippines has remained relatively constant. I believe the reason for this is due to growing concern over Vietnam’s economy and a growing conflict between the government plan to maintain economic growth and the central bank’s goal of controlling growing pricing pressures.

Finally, the following charts show each countries’ CDS movements verse the main domestic equity Index; CDS could be used as a hedge against regional equities. CDS prices tend to have a negative correlation with a country’s underlying equity index. This notwithstanding, hedging an individual equity via sovereign CDS will likely not hedge against intra-day or company specific price movements but will hedge against fundamental economic changes within the country. It is important to keep in mind that companies with traded debt may have its on CDS. However, at this point within Asia this market does not yet seem to be very robust.

Charts:

Source: Bberg

List of CDS traded in Asia

Source: Bberg (pricing from 7/7/08)

S&P500 Short Interest Ratio

Back in March I published some data on the NYSE top 100 short interest ratio (SIR), and a lot of people seemed to enjoy it. I am now following that up with June SIR data for all the S&P500 companies. I broke out the data alphabetically, descending SIR, and by the monthly change of the short interest ratio. Please follow the links below for the tables.

Sorted By:
Company Name
SIR Largest to Smallest
SIR Change (6/30/08-6/15/08)

*Source:Bberg

How might this be helpful? Well besides giving investors an idea of market sentiment on specific securities or sectors; it also creates the opportunity for a potential short squeeze. A short squeeze is when investors cover their short positions in order to stop losses by purchasing the equities on the open market, in theory bringing up the securities price. So, the higher the SIR the higher the potential magnitude of a short squeeze. The Short interest ratio is the amount of days it would take to cover the equities total short interest given its average daily trading volume.

Global Battery Index

As oil prices continue soaring and consumers’ preference shifts to smaller and more fuel efficient vehicles, we are likely to see a proliferation of hybrid technology. Looking at the most recent car sales data in the US, Honda and Hyundai out-sold both GM and Ford mostly due to their wide selection of smaller more fuel efficient vehicles. So what does this have to do with batteries? I believe quite a lot… It would appear the next natural progression in the auto industry will be the development and sale of plug-in hybrids (PHEV). Thus far, production of PHEVs has been extremely limited, mostly due to battery related issues. However, given the current record oil prices and recent advancements in battery technology it is likely this market will show significant growth over the next several years.

Currently, both GM and Toyota are hoping to release PHEVs by 2010. While Ford’s current plan is to release PHEVs sometime between 2012 and 2020. However, Ford’s senior energy storage manager was recently quoted saying, “If there’s going to be a true plug-in hybrid market, we’re going to be there. It’s just that that’s a huge commitment to actually go to production.” Which indicates to me that for the time being Ford will be sitting on the side-line. Coincidentally, Ford’s June sales decreased by 28%, mostly due to their lack of fuel-efficient cars and trucks relative to some of their peers.

The proliferation of hybrids & PHEVs would place large demands on the battery industry, which could provide investors with good investment opportunities within the sector. However, I personally know very little about the players in the global battery industry, so I decided to give myself a quick primer. According to Bberg’s industry classification system, globally the batteries & battery systems sector has 105 members. With this in mind, I decided to create a global market-cap weighted index to track the overall performance of the sector. Out of the 105 companies my index ended up containing 71 members, I factored out companies with bad data and Energizer. I factored out Energizer because of their large market cap, and since as far as I know they are not developing any automotive related battery products. The average market cap of the index totaled USD225.38mn, with BYD co Ltd of China (1211 HK Equity) having the highest market cap of USD2.6bn (16.4% of index). See the chart below for more details.

Index Components with Weighting

Source: Bberg

I now wanted to compare the performance of the index against the S&P500 and WTI prices. To do this I used daily prices and rebased all the prices to 100 on 8/2/2007 (see charts below):

The Global Battery Index has Outperformed the S&P500

Source: Bberg

The Global Battery Index has a Positive Correlation with WTI Prices

Source: Bberg

As you can see from the charts above the global battery index easily out-performed the S&P500 and shows a strong positive correlation to WTI prices. This implies that if energy prices continue to rise or remain elevated we could continue to see the battery outperform the S&P500 as battery related demand increases.

Once this was complete, I geographically broke out the companies. 20 of the 71 companies in the index are located within the US, followed by China with 9, South Korea with 8, and India with 6 (see chart below for more details):

The Top 5 Countries make-up 83% of the Market Cap

Source: Bberg

As you can see from the chart above China, the US, Japan, India, and Taiwan together make-up roughly 83% of the total market cap, while containing 58% of the total companies. To further assist this analysis I created country specific indices to compare against the benchmark; at first I found the results surprising.

Chinese Battery Index

American Battery Index

Japanese Battery Index

Indian Battery Index

Taiwanese Battery Index

*Source: Bberg for all charts

Relative to the overall battery index it is clear that Japan was a significant out-performer. This I believe can partially be explained by the fact that Japan imports nearly 100% of its oil, which among other factors, has led the government to announce oil and gas suppliers will be required to increase the use of renewable energy resources. The government’s pro-active approach coupled by the fact that Japanese automakers, such as Honda and Toyota, seem to be on the forefront of hybrid technology should continue to bolster Japanese demand for battery related products. The three Japanese companies included in the index are GS Yuasa Corp, NPC Inc, & Shin-Kobe Electric Machinery Co. Mitsubishi Motors setup a joint venture with GS Yuasa corporation in Dec. 2007 to provide lithium-ion batteries starting in April 2009. According to Bberg, Shin-Kobe was recently rated a buy from Nomura Holdings Inc. who cited an increasing demand for batteries.

Will the other countries within the index follow suit? I beleive so, but further analysis would be needed to isolate specific equities best positioned to take advantage of the potential increase in demand, and I am not in the habit of recommending specific equities on this blog. The bottom line is, as long as oil prices remain elevated we should continue to see increased demand for battery related products as automakers begin moving towards more hybrid and PHEV technology.

Gold a Bet Against the Fed

Historically, gold has been an asset investors turn to in times of uncertainty, especially in regards to inflation. The same is true today. However, is the level of today’s gold prices justified? I believe the answer to that question depends on your belief in the Fed’s effectiveness and willingness to fight inflation. It is my view that once core CPI begins to approach and exceed the Fed’s comfort zone we will see the beginning of a new tightening cycle, regardless the economic growth outlook. In May core CPI came in at 2.3%, our current estimations point towards the ceiling of the Fed’s comfort zone to be around 2.8% to 3.0%. Once this tightening cycle begins to occur or at least look imminent the USD broad index should begin to appreciate.

With this in mind I created a back of the envelope analysis to calculate monthly gold prices from 1974 to today based on CPI, the USD broad index, and effective fed funds rate. The results were surprisingly promising:

Regression Statistics


R^2 0.83


Coefficients

T Score

Intercept

-28.1

-1.8

CPI

7.5

40.2

USD Broad Index

-8.5

-29.0

Fed Funds

1108.8

10.2

This simple model has tracked gold price fairly accurately since 1974

*Source: BBerg

The graph above shows that according to the model current gold prices are somewhat elevated, but this is likely due to increasing inflation expectations and recent uncertainty in the financial markets, which this model does not account for. What this model does imply however is that if you believe the Fed will act to combat inflation and we see an appreciation in the USD due to increased rates we are likely to see a decline in gold prices. For example, leaving CPI constant, according to the model if Fed Funds were to move to 3.0% and we saw a 5% appreciation in the USD broad index we would se a decrease in gold prices to about USD750, with a 10% USD appreciation we would see gold prices around USD700. Further increases in CPI could off-set some of these losses, but our view is that the Fed’s actions will be enough to curtail increasing inflation expectations, and bring core CPI back into the Fed’s comfort zone, thus in the long run bringing gold prices closer to its historical average.

It is important to note the simplistic nature of this model and is only meant to highlight the mechanics behind how CPI, USD, and rates affect gold prices leaving out many other important factors. In what we would consider an unlikely case if the Fed was unable to control inflation then we would likely see a further jump in gold prices coupled with an appreciation of the USD broad index as he Fed increases rates. Again, we do not advise trading on this simple model.